Residence Time Distribution Measurements
Posted on November 6, 2016 Instrumentation & Equipment Design
Residence time distribution (RTD) measurements provide an effective technique to diagnose flow behaviour within a wide range of flow systems. RTD analysis of a controlled tracer addition into a system can reveal flow distribution characteristics such as short-circuiting, re-circulating zones and dead zones. RTD methods may also be used to develop and validate flow models, and can be applied to field and lab-scale systems ranging in size from millimeters to several meters representing residence times of milliseconds to hours.
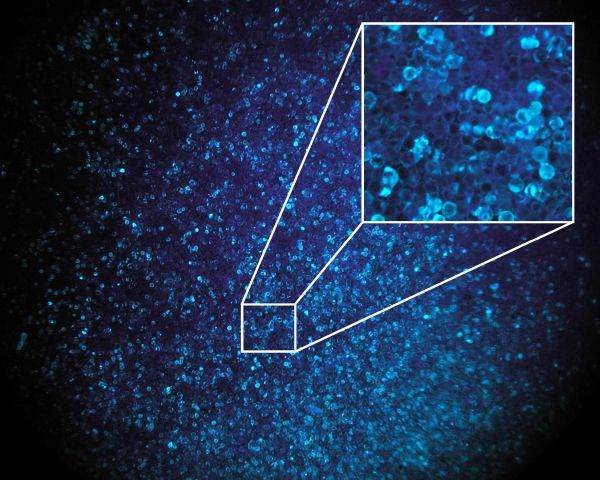
UV tracer particles
RTD Technique
For a simple RTD experiment, a known tracer distribution is introduced into the inlet of a system, and the tracer concentration is recorded at the outlet after it has been modified by the system processes. Analysis of this convoluted output tracer distribution allows insight into the processes that brought those changes about. In addition to this simple case, tracer addition and detection may be performed at locations other than the system inlet and outlet, allowing for the isolation of particular flow phenomena of interest.
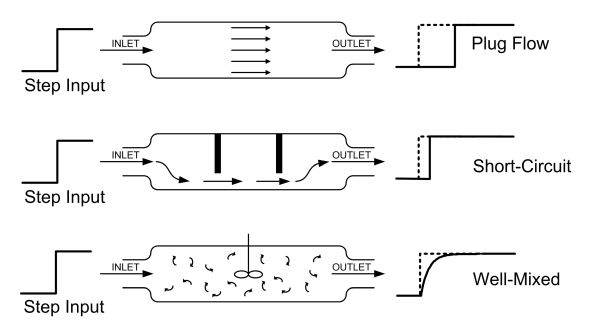
Several examples of system behaviours are illustrated below.
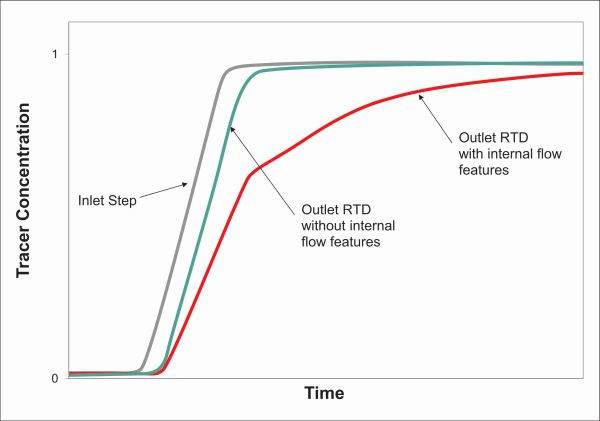
- In the plug flow reactor shown, the inlet tracer distribution is not modified at all by the system process, and is simply convected through while maintaining its original shape. Experimental data demonstrating this effect is shown in the plot below where the Configuration 1 outlet RTD is identical to the inlet step RTD.
- If short circuiting occurs, as shown in the baffled reactor, the step change moves through the system much faster than anticipated due to the non-participation of a large portion of the vessel volume.
- In the well-mixed system shown, the tracer concentration is always uniformly distributed throughout the flow volume as tracer is added and exhausted. In this case the response to a step input is an exponential rise beginning at the moment of tracer introduction.
Application of RTD Methods
RTD applications range from the characterization of flow systems, to determining flow distribution patterns, to developing system models. These elements are combined in an integrated approach designed to address the specific needs of a particular client.
Characterization of Flow Systems
Knowledge of the type of flow behaviour occurring within a process vessel allows for verification of a system design or indication of possible design improvements. For example, the mixing characteristics within a vessel have important consequences for a range of applications with respect to heat transfer, mixing efficiency and conversion rates.
Determination of Flow Distribution Patterns
It is possible to diagnose specific flow distribution problems by examining RTD traces. in the above example, the illustration shows a case of short-circuiting. Portions of the flow volume are not addressed by the process stream, leading to stagnant or “dead” zones. Short circuiting is typified by a tracer transit time that is shorter than the ideal plug flow case where transit time can be calculated using internal volume and volumetric flow rate. These dead zones may cause reactants to linger at specific locations for extended periods, leading to sub-optimal product yields or process performance.
Development of System Models
RTD curves can reveal what physical processes are occurring within the flow system, and provide a basis for developing system models. Results from a step change experiment performed on a process vessel with two different internal configurations. The RTD curve for the configuration without internal features shows nearly perfect plug flow, with the outlet RTD nearly identical to the original inlet tracer step. Under the same operating conditions but using a configuration with internal features, the outlet RTD changes drastically. By developing and evaluating phenomenological models in context with such data, very subtle and complex behaviours within the flow system can be captured and predicted.
Tracer Methods
Gas Tracing
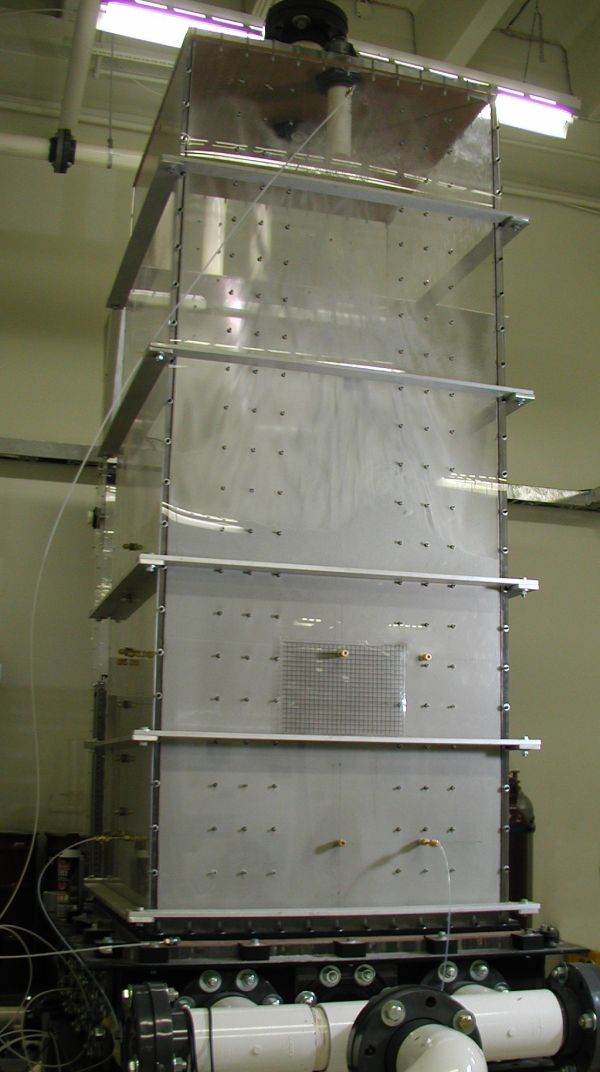
Gas-tracer RTD studies have been successfully conducted on a wide range of systems at Coanda including gas-only, multiphase gas-liquid and gas-solids systems. These studies have included field and lab measurements in packed reactant beds, small-channel condensing flows, and fluidized beds such as the one pictured in the figure below. Gas detection systems have included a photo-ionization detector, infra-red detector and thermal conductivity detector.
Available tracer gases include:
- Propylene
- Propane
- Ethane
- Helium
- Hydrogen
- Carbon Dioxide
Liquid Tracing
Coanda has well-established expertise in applying advanced liquid-tracer RTD techniques. These techniques have been applied to systems ranging from stirred tank reactors to inertial mixing and separation vessels containing liquid-only as well as liquid-solid (slurry) flows. Primary diagnostics include a laser-induced fluorescence technique. This is where a tracer of fluorescent dye solution is introduced into the liquid system and then traced using laser illumination. In addition, conductivity probes are available that use saline solution as a tracer, and are effective in obscured flows or opaque liquids.
Solids Tracing
A novel method of solids tracer addition and sampling has been developed at Coanda for performing solid-phase RTD studies in gas-solid (fluidized bed) reactors. This technique was successfully applied to the fluidized bed shown. Other available techniques for solids tracing include heat tracing as well as fluorescent (such as the UV phosphorescent-dyed particles in a background of un-dyed particles; the dyed particles get charged under ultraviolet illumination shown above, prior to injection into the system, where they continue to phosphoresce) or visible dye tracing.