Bayesian Parameter Estimation
Posted on November 16, 2023 Big Data Machine Learning & AI

Often, we want to describe a process using a model. Having collected some data, we can fit our model and retrieve values for its parameters. Great, now we have numbers for these parameters, but how certain are we in these values? How likely is it that a parameter is a bit lower than this value? Or is it equally likely that this parameter could take any value? Using Bayesian inference, we can retrieve the distributions for these parameters and better determine the uncertainty in our model.
First, we make the probabilistic relationship between the outcome and input variables explicit. Let’s take a simple example of a damped harmonic oscillator. Here, we can write the output amplitude, y, as a function of time, t, using,
y(t) = A0 e-γt cos(ωt-α),
where A0 is the undamped amplitude, α is the initial phase shift, γ is the damping time constant, and ω is the frequency of oscillations. Here, we assume that we already know A0 and α, and we will try to determine γ and ω from the data.
To make things probabilistic, we write our modeled amplitude as ym ~ N(y(t), σ2) where N(μ, σ2) denotes a normal distribution with mean μ and standard deviation σ, and fit this relationship to our data. This is the same as a curve fitting regression exercise, but provides a probability distribution (posterior) for each of the parameters ω, γ and σ. The advantage is that we get better uncertainty estimates for the model parameters and predictions.
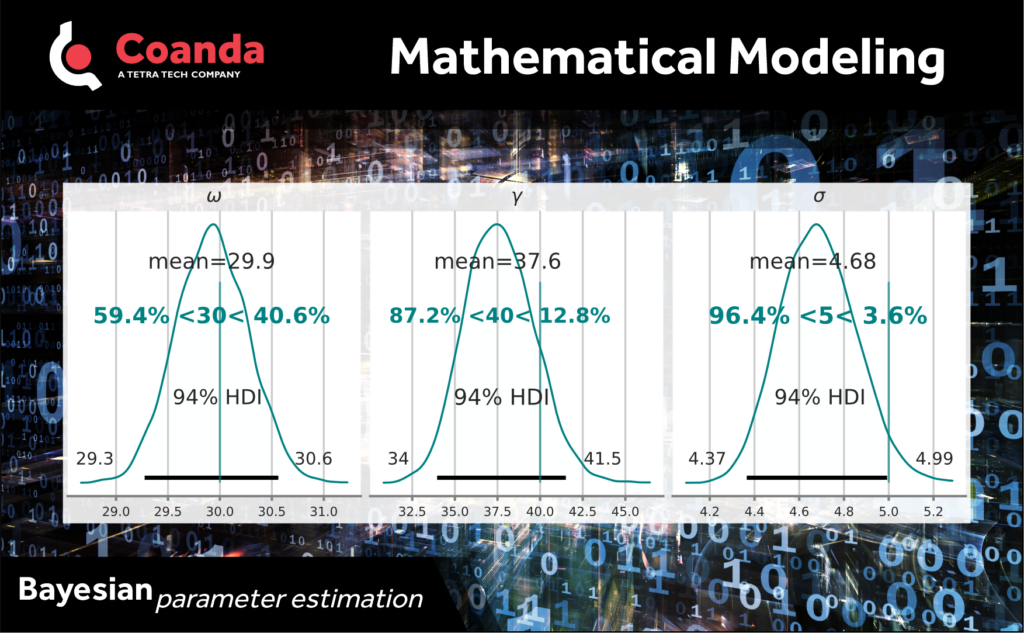
Now we have probability distributions for each of the parameters. We can see that the parameter values are tightly centered on the mean best fit – look at the spread in the 94% highest density interval (HDI).
In this example we know the true values for these parameters (green vertical line and green text in lower plots). The fitted distribution for ω has a mean value that almost perfectly matches the true value, whereas more than 80% of the distribution for γ is below the actual value.
By sampling from these distributions, we can further probe how tightly our predicted amplitude is centered around the mean prediction and compare it with the spread in data.