CFD – Flow Transition in Restriction Devices
Posted on November 9, 2023 Computational Fluid Dynamics
This post was originally published in two parts which have been combined below.
Part 1
Valves and flow control devices within industrial processes are responsible for regulating and optimizing fluid flow to achieve desirable conditions. The performance of these devises, often characterized by the discharge coefficient, is primarily dependent on geometric properties (shape and dimensions), inherent fluid properties (viscosity and density), and flow rates. These parameters can be represented by the Reynolds number. The discharge coefficient, expressed as a function of Reynolds number, plays a critical role in understanding fluid flow both within and external to the restriction devices.
Understanding the flow dynamics downstream of restriction devices is useful for gaining insight into the internal flow behaviour. As the fluid exits the device, it can experience various flow patterns, fluctuations, and turbulence. The transition from laminar to turbulent flow, often indicated by shifts in the discharge coefficient, holds the key to these flow changes. This understanding helps to determine the influence of turbulent phenomena on device performance and pressure variation across the restriction.
The design of the restriction is always linked to the quantification of discharge coefficient, and lab experiments can elucidate the relationships between the discharge coefficient and Reynolds number.
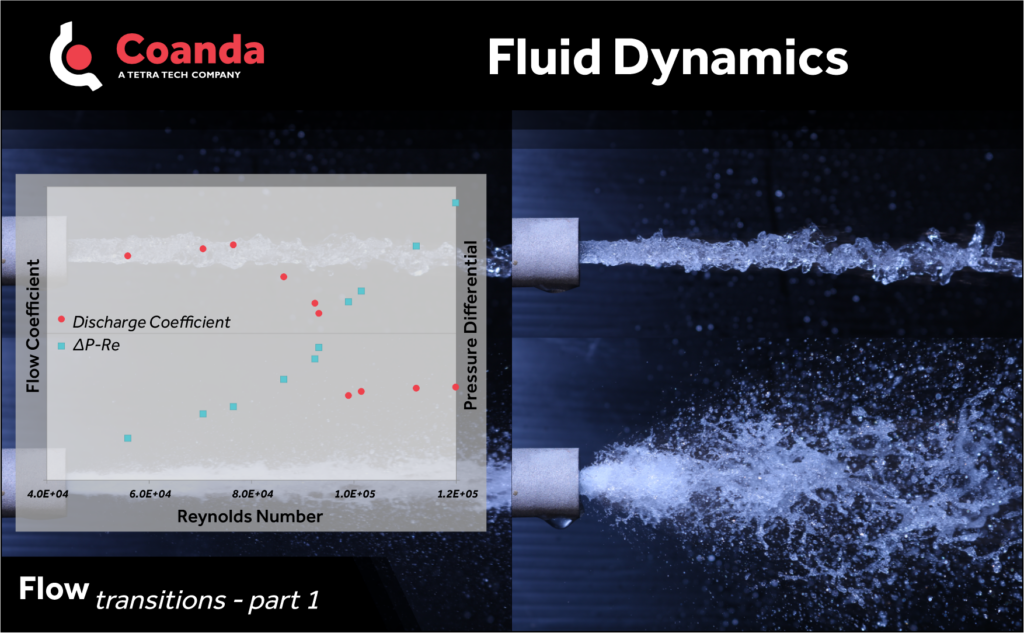
The following figure depicts the discharge flow of water from a restriction device, operating at various flow conditions. At a pressure drop of 4, a pronounced and explosive shift in flow behavior occurs, causing the liquid stream to fragment into droplets immediately after exiting the nozzle. This shift indicates a transition from the initial flow regime to a fully turbulent state, which also shows causes a sharp reduction in the discharge coefficient, as highlighted in the accompanying graph.
Experimental observation and flow visualization enhances our understanding of fluid behavior, advancing the optimization of fluid systems.

Part 2
In the previous post, we explored the significance of flow visualization in identifying flow transitions within restriction devices under cold flow conditions, where the fluid maintains its liquid state as it passes through the device. This transition, from laminar to turbulent flow, is evident in discharge coefficient graphs and changes in mechanical breakup of the liquid jet upon exiting the device.
When we shift from cold flow to high temperature flow, we encounter a phenomenon known as flashing. This is when a high-temperature fluid undergoes a sudden phase change to vapour as pressure decreases upon passing through the restriction device.
This high temperature flow adds complexity to the flow dynamics, influenced by thermodynamics of phase change. The device resistance is linked to the Reynolds number, the difference between the inlet temperature and saturation temperature, and many other flow parameters. The onset of flashing affects the pressure and velocity distribution within the restriction device, impacting its performance in high-temperature applications. Thus, understanding these characteristics is critical for optimizing device performance and ensuring its reliability in a wide range of operational conditions.
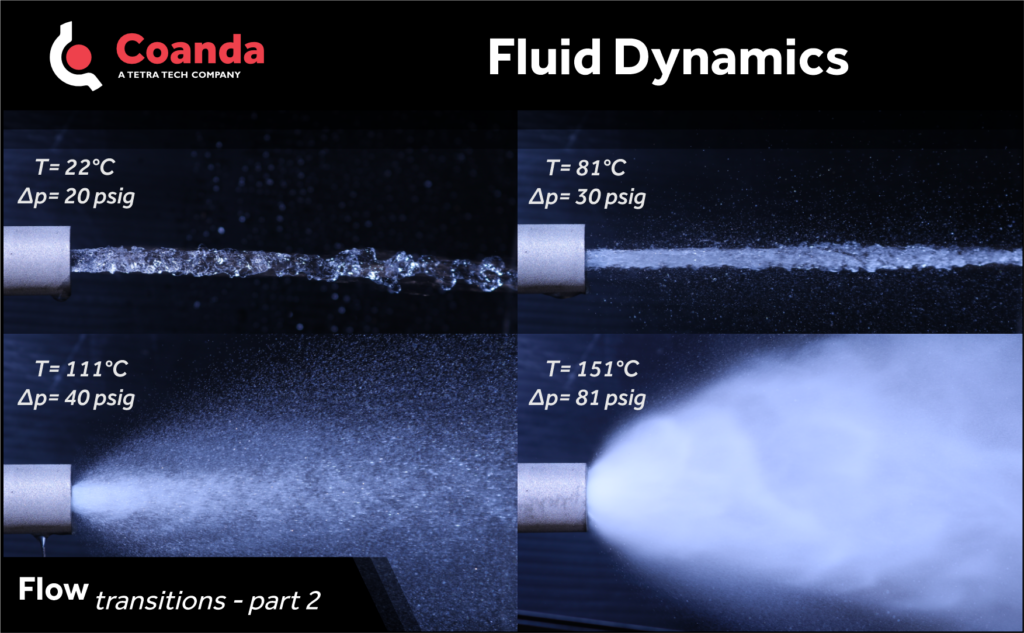
To illustrate flashing, we present high-speed flow visualizations of water flow exiting from a restriction device at a constant flow rate but varying inlet temperatures. The pressure drop for each case varies, emphasizing the complex relationship between temperature, flow, and performance of the restriction device.


