CFD modeling aerated lagoons
Posted on October 11, 2022 Computational Fluid Dynamics Water

This post was originally published in two parts which have been combined below.
Part 1
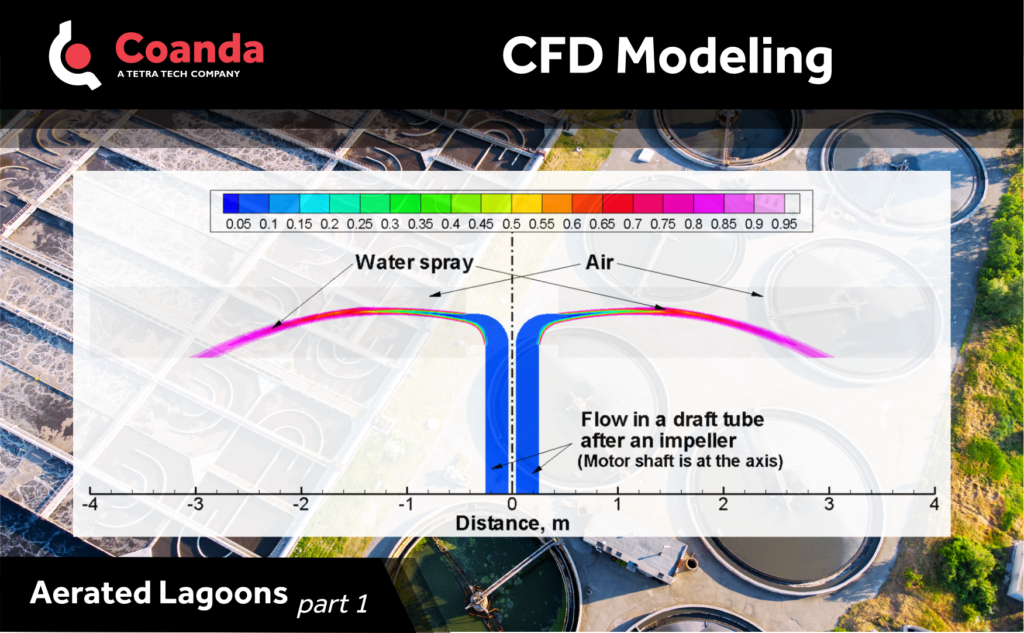
Large, aerated lagoons are commonly used for biological wastewater treatment. Atmospheric oxygen transferred at the water surface is not sufficient for the aerobic bacterial process and must be supplemented by mechanical aeration. Additionally, mixing is necessary to maintain partial suspension of bacterial solids and ensure adequate contact with organic pollutants. Floating mechanical surface aerators provide simultaneously both mixing and oxygenation. To improve lagoon performance and optimize placement of the aerators, a greater understanding of flow patterns is required. This understanding can come from dye propagation experiments and from computational modeling.
A hydraulic model can provide important knowledge for the design of mechanically aerated lagoons and can also serve as a base for further studies. Knowing the velocity and turbulence field, residence time information can be obtained and analyzed.
Moreover, the hydraulic model can be the basis for a comprehensive lagoon model that includes complex biological processes.
In a recent project, we approached the model development by decoupling the aerator from the lagoon flow. The outcome of the aerator simulations, as shown, are applied to a lagoon model as boundary conditions: flow inlets, where the spray lands on the water surface, and outlets, where the water is pumped up the draft tube.
Tune in to our next post we’ll cover the approach we used to develop a suitable CFD model of a lagoon.
Part 2
In our previous post we introduced the use of aerated lagoons in wastewater treatment and the manner in which CFD modeling can be used to optimize performance.
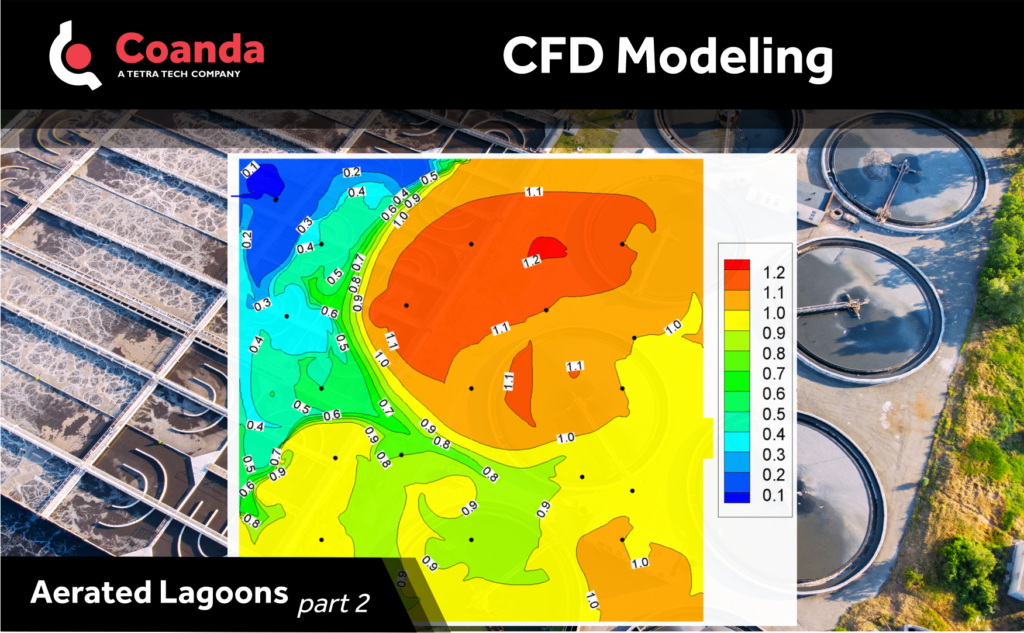
After validation of the approach for a single aerator simulation (explained in our earlier post), we applied the model to a large, aerated lagoon. Contours of relative local average residence time (age of fluid) are shown in this figure where aerators are denoted as black dots.
If the lagoon was operated as an ideally mixed reactor, the value would be 1 throughout the domain. However, we can see an area to the left and the lower side of the plot where the liquid spends less time than average. This area can be interpreted as the counterclockwise bypass flow from the entrance to the exit. In order to improve mixing performance in this zone, the addition of some aerators would be beneficial. On the other hand, the relative residence time is more than the average in the area in the upper right part of the lagoon. It is likely that there is more internal recirculation and less interchange with the surrounding areas.
This type of model can be applied to an industrial lagoon to predict the flow behaviour and provide an engineering tool for analyzing impacts of aerator placement and lagoon design. Additional post processing, done by solving an age-of-fluid equation, provides visual and quantitative information to describe internal lagoon mixing characteristics.