Pattern-matching in data series
Posted on October 3, 2025 Big Data Machine Learning & AI Mathematical Modeling

Today we’ll look at a few considerations when using correlation- or convolution-based methods for pattern-matching in long data sets.
Depending on the field, and whether or not you are working with parts of the same data set, terminology might include autocorrelation, serial correlation, autocovariance, or just template matching.
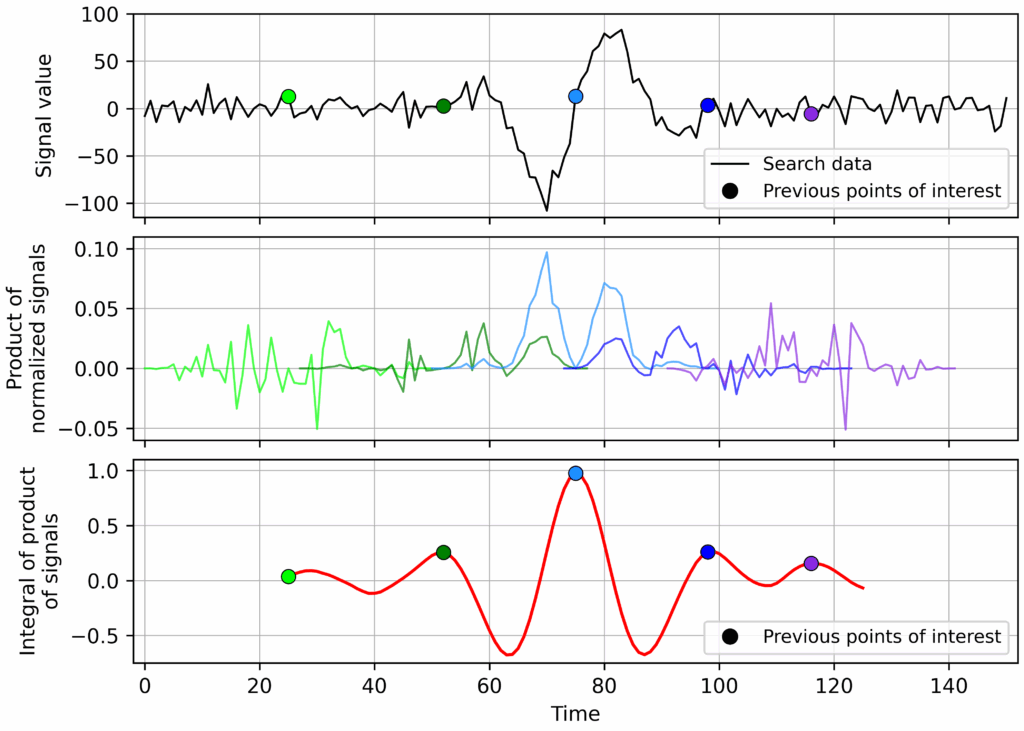
In these examples we’re looking at a long 1D time-series data set of intensity values, trying to find the location of instances that match a known pattern. We’ll start from an observation/conjecture that if you take the convolution (integral of the product of two functions, after one is flipped and shifted, for all possible shifts) of a kernel on a long data set, instances of the (flipped) kernel (i.e., the search pattern or template) in the long data set result in local maxima in the output convolution signal.


In the above example, we see that the shift that “lines up” the search template with the occurrence of the pattern in the search data results in the largest integral of the product of the signals. This makes sense because it pairs the biggest values with the biggest values (maximizing the square) and the negative values with negative values (again, maximizing the square). We found the location of the best match, even with some noise in the dataset!
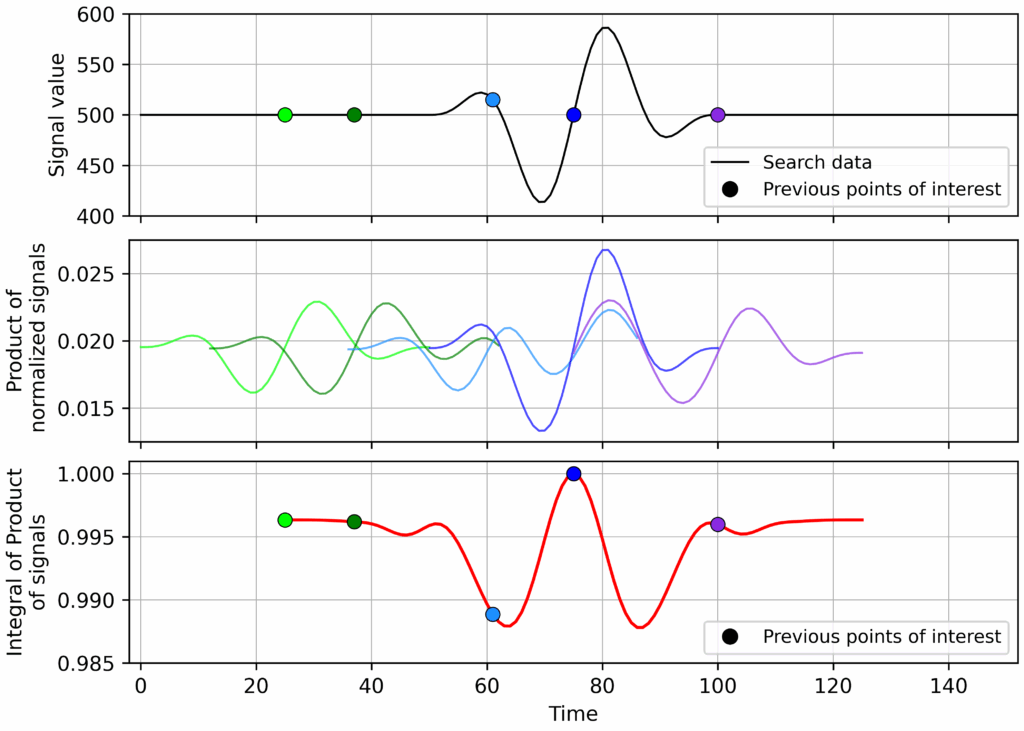
Unfortunately, this doesn’t always work. Let’s see what happens if we add a positive offset to both functions, even in the absence of any noise:


Woah – we got an unexpected maximum that’s not where the functions line up! And it’s bigger than the maxima associated with the “real” lineup. Why? “You’re doing it wrong” is one answer – but there can be some intuition too. In this case the template we’re “searching” with forms an interrogation window, since any parts of the longer signal we’re not looking at are not included in the integral. So we end up with a global maximum at the spot where the search signal is still “similar” to the template, but that excludes the low values in the search data set. So, clearly, we need to adjust our procedure. This can be done by normalisation… but how exactly should we normalise the signals?
Unfortunately, this “interrogation window” problem is unavoidable – we can’t just apply a “global” normalisation to the long data set we’re searching through. If we consider the evaluation of any particular shift as a dot-product between the two “vectors” (the search template and the corresponding slice of search data) we can recognise a solution – both vectors can be normalized to be of unit length.
Then, if they are the same, the sum of their products (aka – the dot product) will be 1. As a bonus, we’re left with a more objective criteria for success as the value for a perfect match is now 1, instead of some arbitrary value.
So, before evaluating the sum of the products for a given shift we convert the vectors to be of unit length (divide each vector by the square-root of the sum of its values). Note that, computation-wise, it may be faster to normalise the search-template, use a built-in convolution function, and calculate a scaling factor for each shift value based on the region of the search data used. Now, with the normalisation included, the correct match point is identified:
For the original example with noise, with the normalisation, the outcome looks very similar albeit with some scaling of the signal product and the integral:
So, we can do the above if we want to get the right answer. But what about offsetting the data? And how? Well, that depends on your data set. Some considerations:
- Offsetting both the search data and the search template by the same value (for example, the mean of the search template) is optional. This will likely increase sensitivity for cases where the search template doesn’t oscillate around zero.
- Offsetting the search data and the search template by different values (say, their own mean values). Whether or not this is a good idea depends on your data set, and now we’re talking about really massaging things, not just “doing the right thing”. If the search data and template looked similar, but with a huge offset, should that really be considered a match? Depends on your data. Similarly it might make sense to consider removing local trends in the search data by some non-constant value as well.
Note that the above method finds occurrences of the template in the search signal up to a constant positive scale factor. If the specific amplitude of the search template is important, then an additional step would be required. What we described here is very similar to a matched filter used in signal processing.
As a final comment, normalising to make both “vectors” unit vectors is equivalent to the cosine similarity measure. This is a metric that can used to measure how similar in “direction” two vectors from the same space are. Cosine similarity is also commonly used in machine learning and data mining, for example in recommender systems or text analysis. If the characteristics of an item—a product, customer, body of text—are embedded into a “latent” vector space, then cosine similarity can be used to identify “similar” items.