Pipe Visualization
Posted on May 15, 2017 Instrumentation and Equipment Design

Observing Pipe Flow
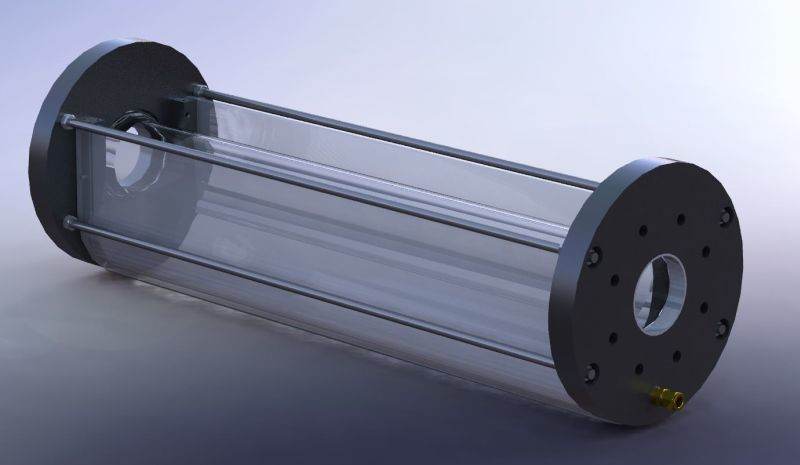
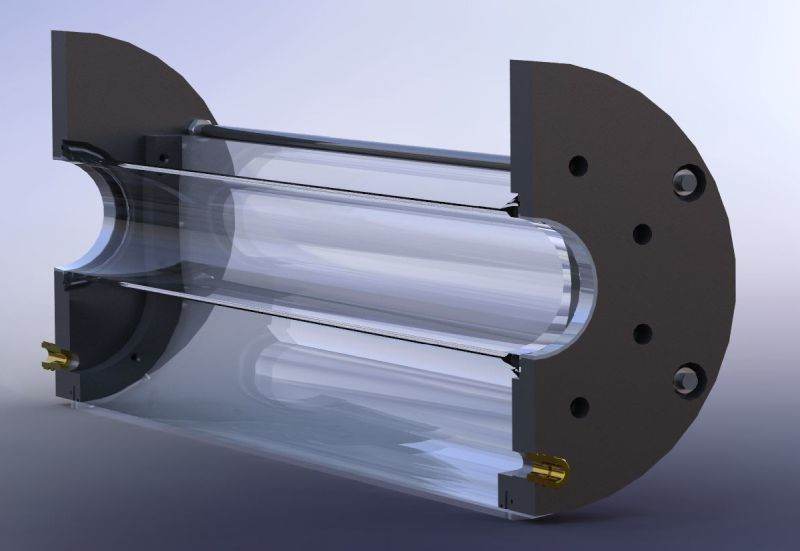
Coanda was contracted by the Alberta Research Council to design and build a visualization test section for their pipeline slurry wear test facility (which we also developed and installed at their Devon research laboratory). The visualization section allows for both qualitative and quantitative data to be collected on the material flowing inside the pipe.
The visualization section had to provide an unobstructed view of the pipe, cancel out the lensing effects of the curved pipe surface, operate under similar conditions to the test pipeline, be wear resistant and provide the flexibility to replace worn components.
Visualization Section Specifications:
- Maximum Operating Pressure: 80 psig
- Max Operating Temperature: 80°C