Solids Circulation Measurement
Posted on April 25, 2023 Physical Modeling

Measuring a fluidized bed’s solids circulation rates can be challenging, especially when internal circulation rates are desired.
For conventional circulation systems, where solids are removed from and returned to the dense bed using external transport lines, solids flow rates are often calculated from the pressure drop measurement across restrictions such as valves on standpipes, or geometry changes in risers.
For crossflow bed designs such as shallow flumes or toroidal geometries, solids flow rates are typically correlated with pressure drop across flow obstructions such as weirs or baffles. For the latter cases, solids flow correlations with pressure drop generally require experimental calibration of each geometry for a precise measurement.
In a solids circulation measurement program conducted on a toroidal fluidized bed at Coanda, the crossflow solids circulation rates were determined using a phosphorescent solids tracer technique. This technique involves the injection of a small amount of tracer and detecting its presence using optical probes at different locations throughout the bed. Prior to injection, the phosphorescent tracer is energized under ultraviolet (UV) illumination inside a separate, custom-designed fluidized bed. This fluidized bed consists of a 2-inch × 48-inch glass section containing the fluidized pigment surrounded by UV fluorescent tubes.
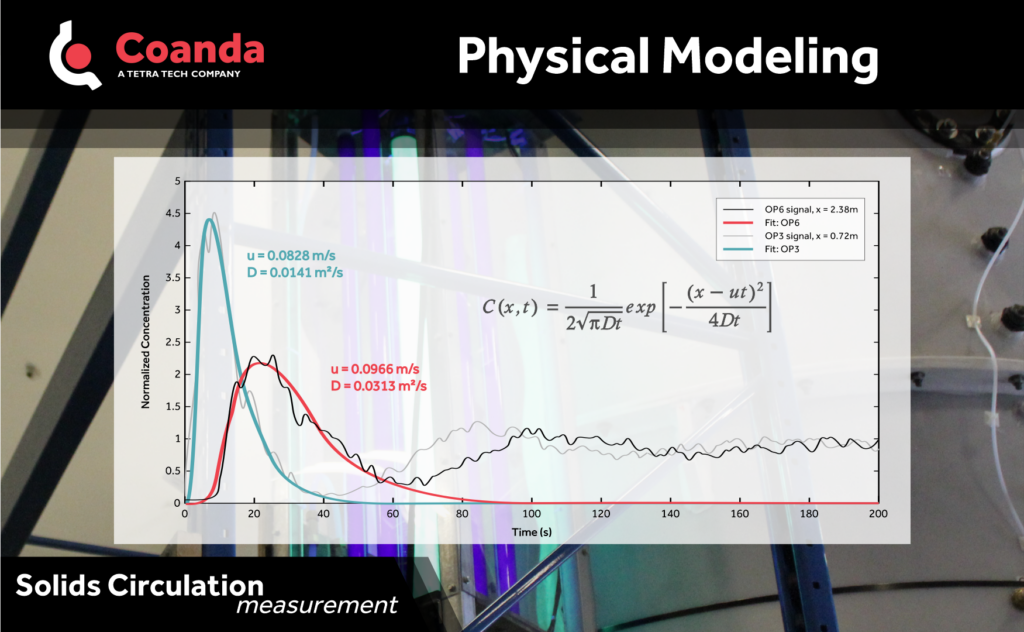
Solids circulation rates were determined by measuring solids advection velocities, obtained by curve fitting the tracer residence time distributions (RTD) measured by the optical probes. The curve fit used is an analytical solution to the general one-dimensional transport equation, where (C) is the tracer concentration at the detector location, (D) is the dispersion coefficient, and (u) is the advection velocity. The tracer concentration is a time dependent parameter, with t=0 being the tracer injection time. The tracer concentration is also a function of the separation distance (x) between the tracer detector and the injection location. Two sample solids RTDs and curve fits are shown in the figure.