Directed Acyclic Graphs (DAGs)
Posted on July 18, 2023 Mathematical Modeling
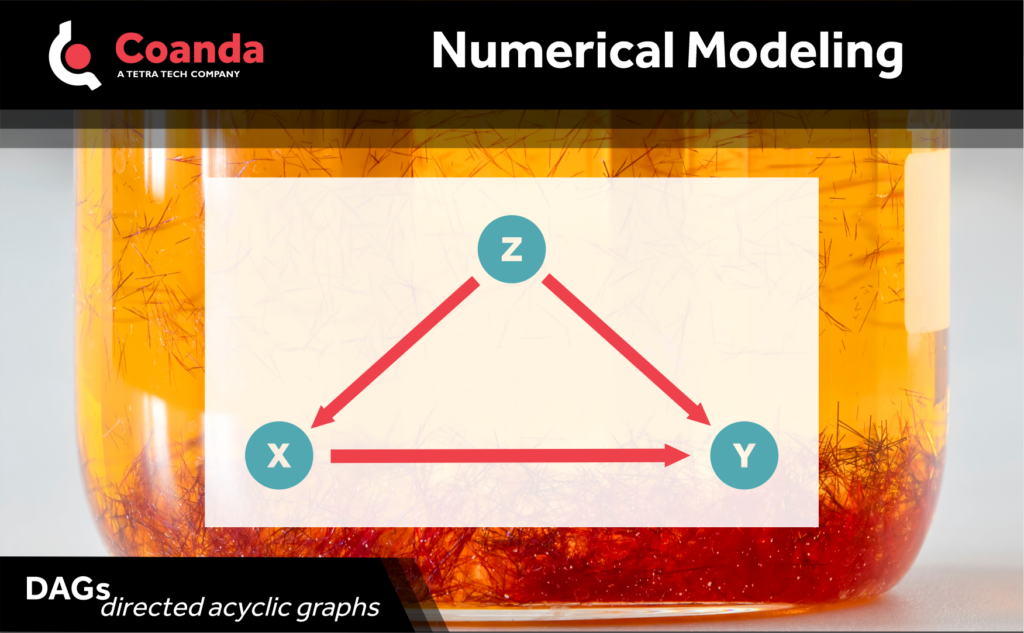
Directed acyclic graphs (DAGs) are visual representations used in causal modelling and many other fields. As shown in the figure below, variables are represented as nodes and connected with arrows (“directed”) which indicate the causal relationships. These arrows can never form a loop if they correctly depict the causal structure of the model (“acyclic”). Typically, we are interested in understanding how much certain variables influence a particular output. DAGs can be surprisingly useful for identifying common causal structures and guiding the modelling process to ensure a proper understanding of the phenomenon.
The example DAG shown here depicts a confounder structure. A confounder variable is one that influences both the output variable and an input variable. This can lead to incorrectly inferring that the input has a certain effect when it is actually caused by the confounder. For example, imagine you are interested in the effect of pH (X) on a crystallization process yield (Y). If there is a variable that affects both the pH and the yield, e.g., an additive concentration (Z), then it is important to include this variable in your statistical analysis. If you don’t you might think that pH was controlling the yield, when instead some or all of the effect could have been related to the additive.
Another causal structure is a collider. In this case the arrows point towards the additional variable, indicating that both the input and output influence the collider. With this structure there is no causal path from the input through the collider to the output and you do not want to control for the collider. Doing so could introduce a misleading spurious correlation between the input and output.
For a bit of casual fun, the “daggle” app (inspired by the popular web-based word game Wordle) allows you to hone your causal inference skills by presenting a series of randomly generated DAGs and asking the user to identify which variables should be controlled to determine a desired effect.


