Data Analysis – Understanding Uncertainty
Posted on February 17, 2022 Big Data Machine Learning & AI

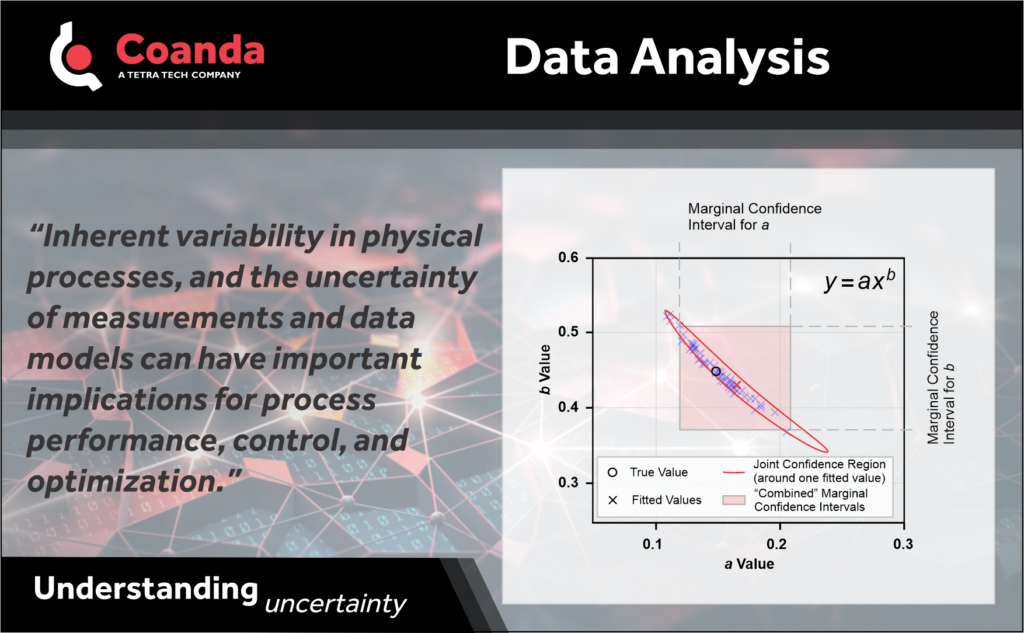
In data analysis, understanding uncertainty is key. Inherent variability in physical processes, and the uncertainty of measurements and data models can have important implications for process performance, control, and optimization. It could make the difference between a project’s success or failure. We use a variety of methods, such as mathematical simulations (e.g., Monte Carlo) and Bayesian modeling, to evaluate variability.
For example, when a regression is performed to fit a model to data, we must examine the uncertainty or confidence in the fit. In the plot shown, a power-law function is repeatedly fit to process samples (which have some error). For one of the fits the marginal confidence intervals (or standard error) of each parameter, as might be reported by a standard curve fitting tool, are shown. However, if we calculate the joint confidence region, we see that the fitted parameter values are highly correlated, and that using the marginal confidence intervals overestimates the true uncertainty. (The plot also shows the estimated parameter values obtained from repeated sampling.) Knowing this correlation between the parameters and accurately estimating the joint confidence region can influence decisions.